Executive Summary: Market corrections are inevitable but don’t always signal a bear market. Over time, staying invested has paid off—even when corrections temporarily push portfolios underwater. This article puts the current correction into perspective and explains why a disciplined approach is key to weathering market downturns.
It’s official—the stock market has “corrected.” As of Thursday, March 13, the S&P 500 index has fallen 10.1% from its February 19 high.
For the record, market “pullbacks” are typically defined as a 5% decline from a prior high. If the index falls 10%, we are in a “correction.” A 20% drop puts us in a “bear market.” And a decline of 33% or more from a high is a “crash.”
Put all the terminology aside. Investors don’t really care what it’s called; what matters is that their account values have fallen from their highs along with the market.
With the Trump Administration’s trade war heating up and uncertainty rising, it’s no surprise that investors of all ilks are worried about what comes next. Will today’s market correction become tomorrow’s bear market … or worse?
It’s a good question, but also one that has no answer. So, let me provide a little perspective rather than a definitive yes or no.
First, remember that corrections are normal, and you shouldn’t let them prevent you from spending time in the market.
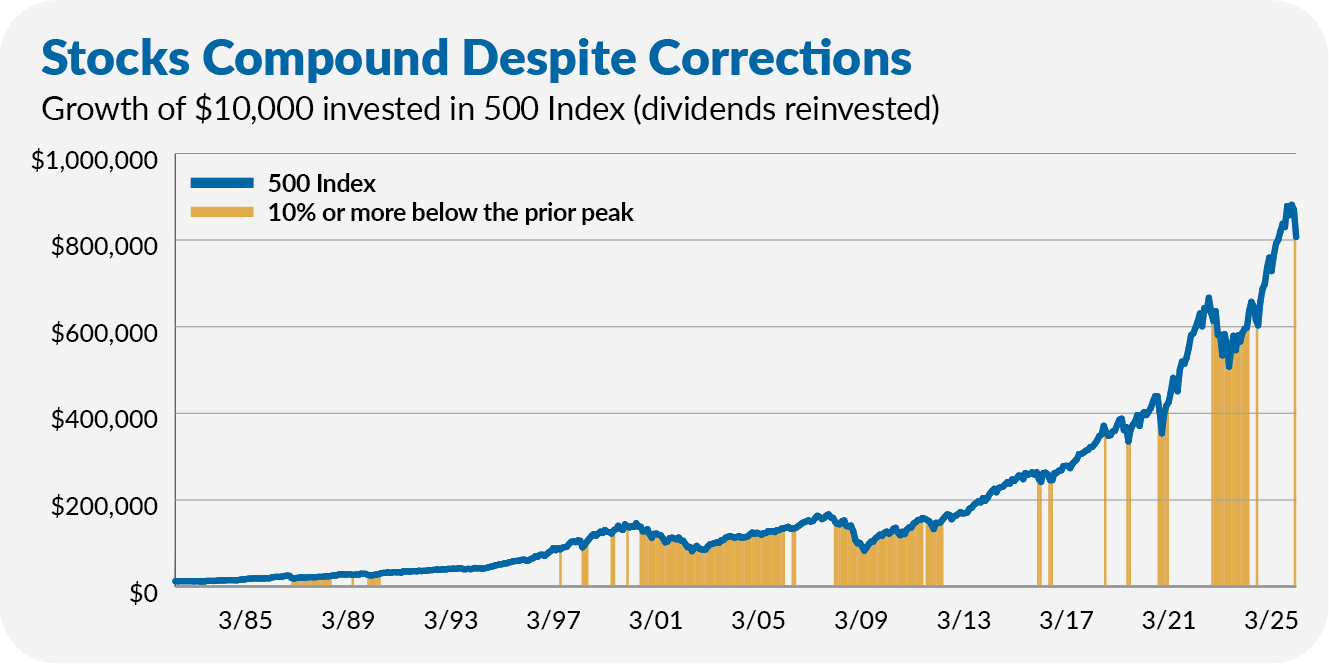
Over the past four decades (between June 30, 1983 and March 13, 2025), 500 Index (VFINX) has compounded at an 11.1% annual rate (with dividends reinvested), turning $10,000 into nearly $805,000. However, 30% of the time, an investor’s position in the fund was 10% or more below its high-water mark.
The chart below shows the trajectory of an investment in 500 Index. The yellow (or gold) bars mark when the flagship fund was down at least 10% from a prior high. As the chart shows, sometimes those corrections were fleeting, and other times, the index fund was underwater for an extended period.
This brings me to another point: While every bear market follows a correction, not every correction leads to a bear market. The chart below is similar to the one above, but now the red bars show when the index fund was in a bear market (20% or more below its prior high).
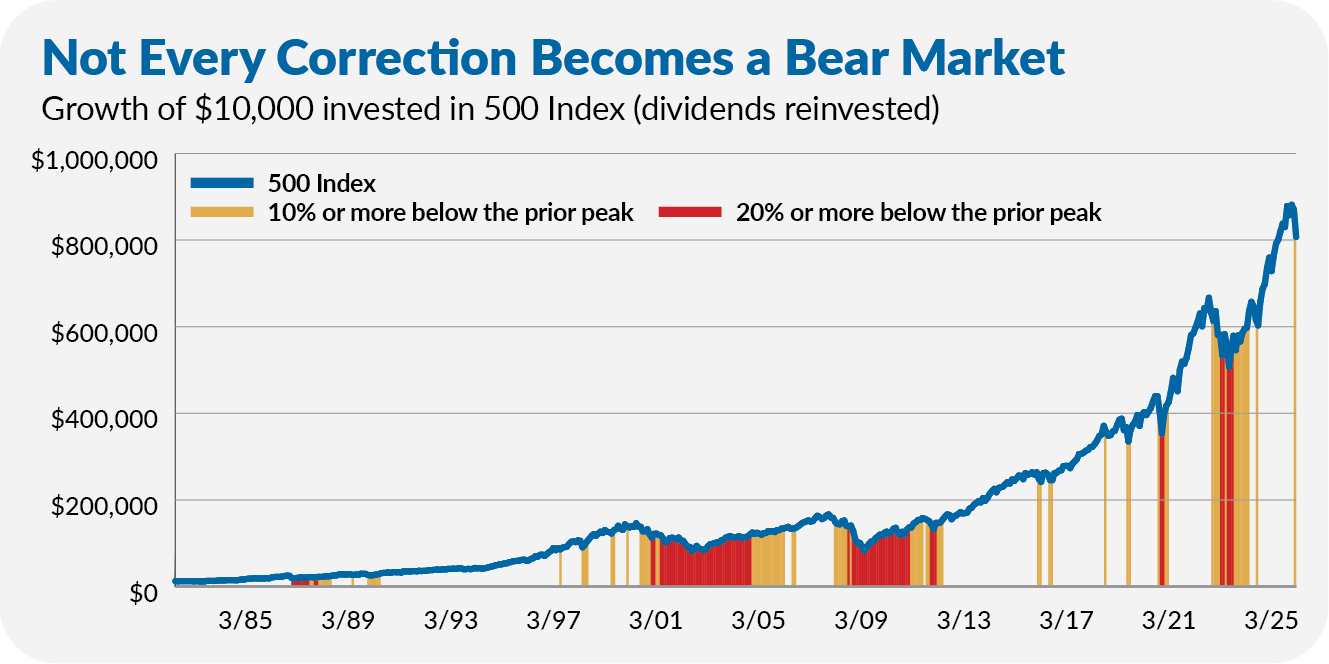
Some market corrections were buying opportunities. Other times, they were a precursor to further losses. Unfortunately, I’ve never met or heard of anyone who could tell you ahead of time which corrections would lead to bear markets and which would simply peter out.
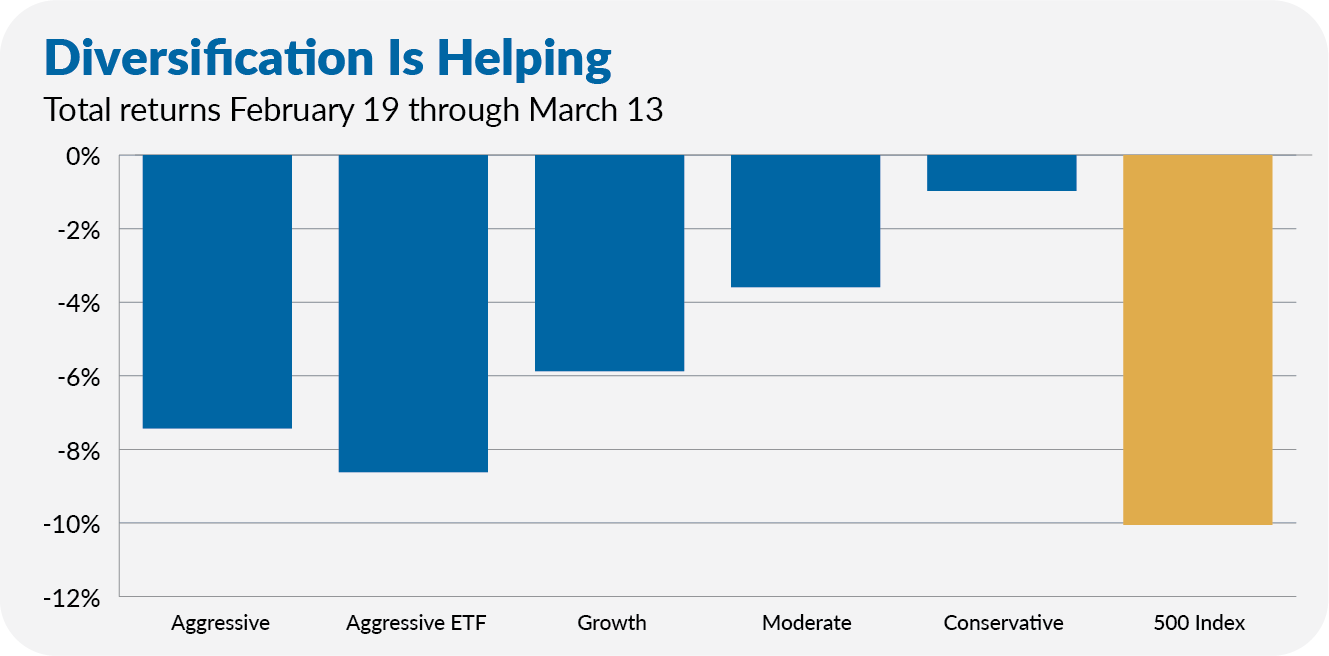
Finally, while the data may show the market in a correction, your portfolio may not be. The chart below compares the performance of the IVA Portfolios with 500 Index since the stock market peaked on February 19.