🚨Public Service Announcement: Keep politics out of your portfolio.
I wrote about politics and your portfolio in June—before the first Biden-Trump debate—so I won’t rehash the entire piece now. But with two months to go, the noise around the election is getting louder and louder.
The key point of my June article is just as true today as it was then: Don’t let election-year noise derail a well-considered investment strategy.
As I mentioned the other week, this was a good summer to be Rip Van Winkle.
Investors’ mettle was tested as traders threw a hissy fit in mid-July and early August. At one point (August 5), 500 Index (VFIAX) was 8.4% below its July 16 high. Japan’s Nikkei index tumbled 12.4% in a day. The CBOE VIX index, called the “fear gauge,” spiked from 16 to 38 in three days.
Yet only three of Vanguard’s funds are down over the past two months—Commodity Strategy (VCMDX), Information Technology Index (VITAX) and Energy Index (VENAX)—and they are only off 3.2%, 0.4% and 0.3%, respectively.
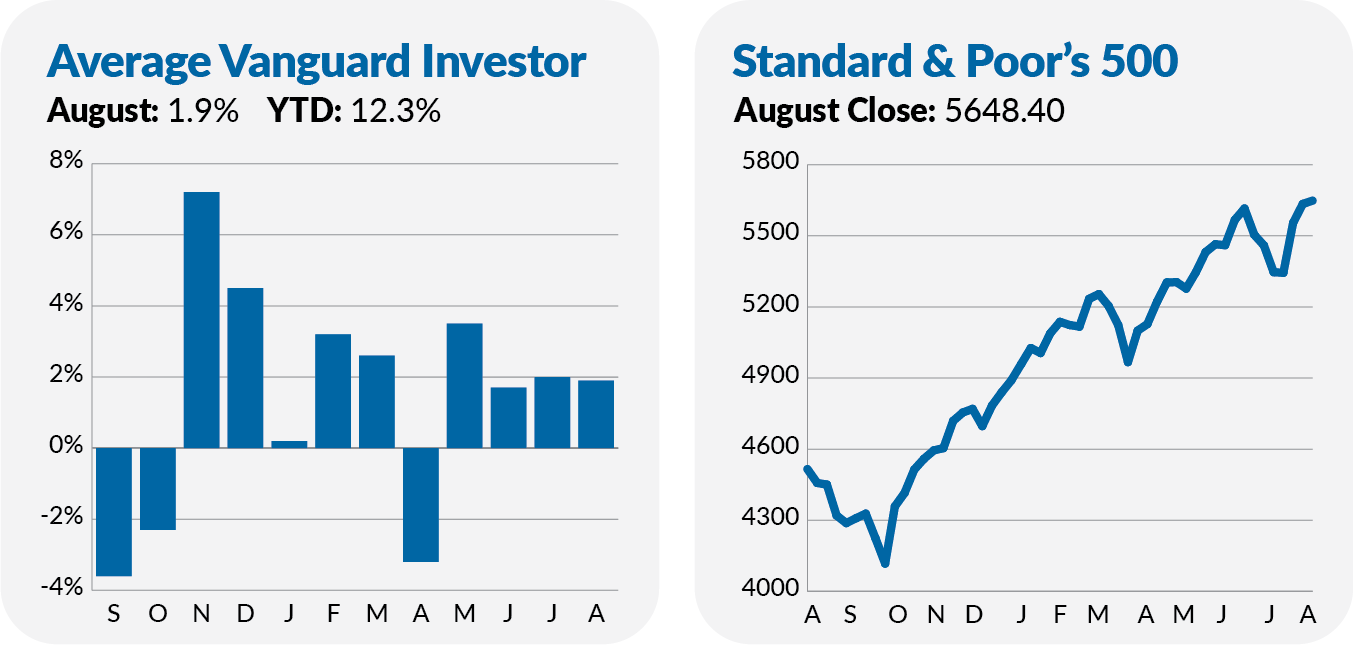
500 Index (VFIAX) gained 3.7%, while SmallCap Index (VSMAX) returned 6.9% and Total International Stock Index (VTIAX) advanced 5.3%.
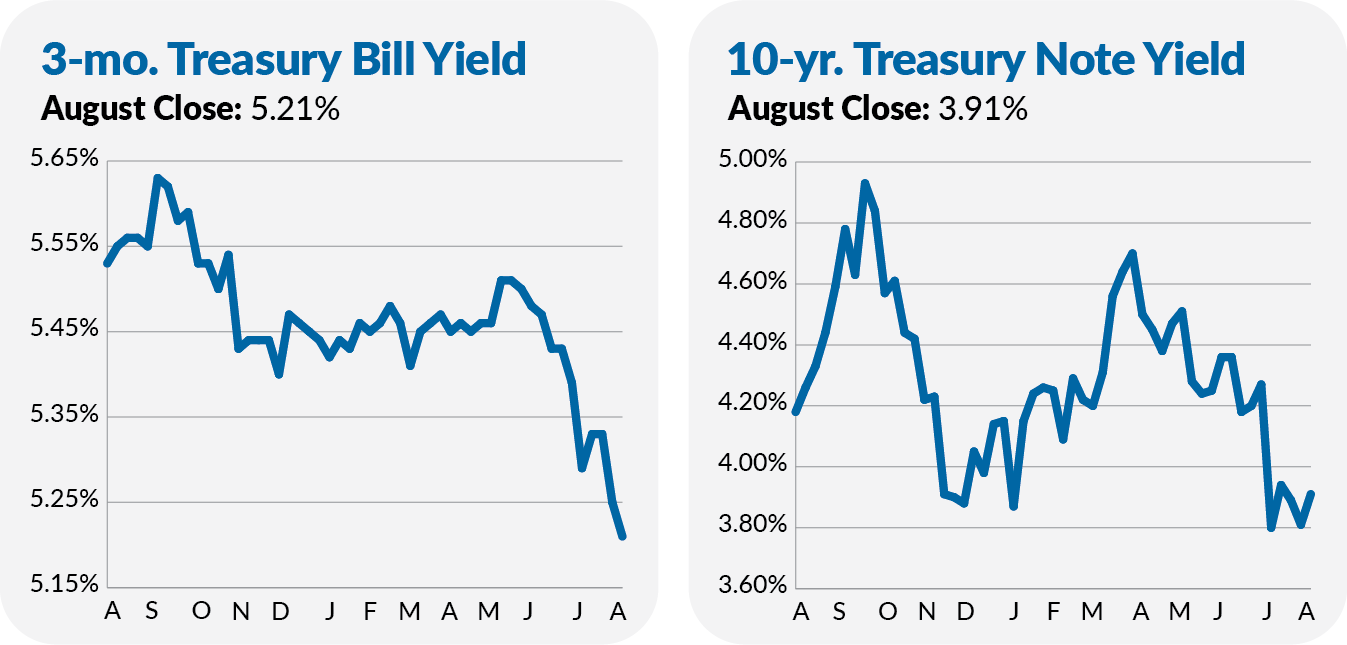
Bonds also did well this summer as traders tried to get ahead of expectations that Federal Reserve (Fed) policymakers would soon cut interest rates. With inflation cooling and the unemployment rate creeping higher, the Fed heads are all but assured to cut their benchmark fed funds rate in September.
I’m working through a two-part series on what a “Fed rate cut” means for our portfolios—you can read part one here. However, despite all the focus on the Fed, it’s important to remember that policymakers do not directly control all interest rates.
For example, though the Fed has yet to act, the yield on the 10-year Treasury has fallen from 4.36% at the end of June (it was at 4.48% on July 1) to 3.91% at the end of August. As rising bond prices go hand in hand with falling yields, Total Bond Market Index (VBTLX) has gained 3.7% over the past two months.
Put it all together, and the average Vanguard investor’s portfolio is 4.0% larger today than at the end of June.
The past two months can be one example of why I advocate for (and practice) spending time in the market. Let me give you another example:
While reflecting on last week’s Weekly Brief, which discussed NVIDIA, the markets and valuations (if you haven’t read it, I highly recommend you do), I was struck by one stat: Since the end of 2016, 500 Index has compounded at a nearly 15% annual pace.
In the article, I made the point that those returns were earned despite stocks being as expensive (if not more so) than they were at the peak of the 1990s tech bubble—at least measured by a standard metric known as price-to-sales. That’s remarkable, and it contradicts what the value-investing crowd would tell you.
But an equally important observation is that those better-than-average double-digit annual returns were earned despite two bear markets and one near-bear market.
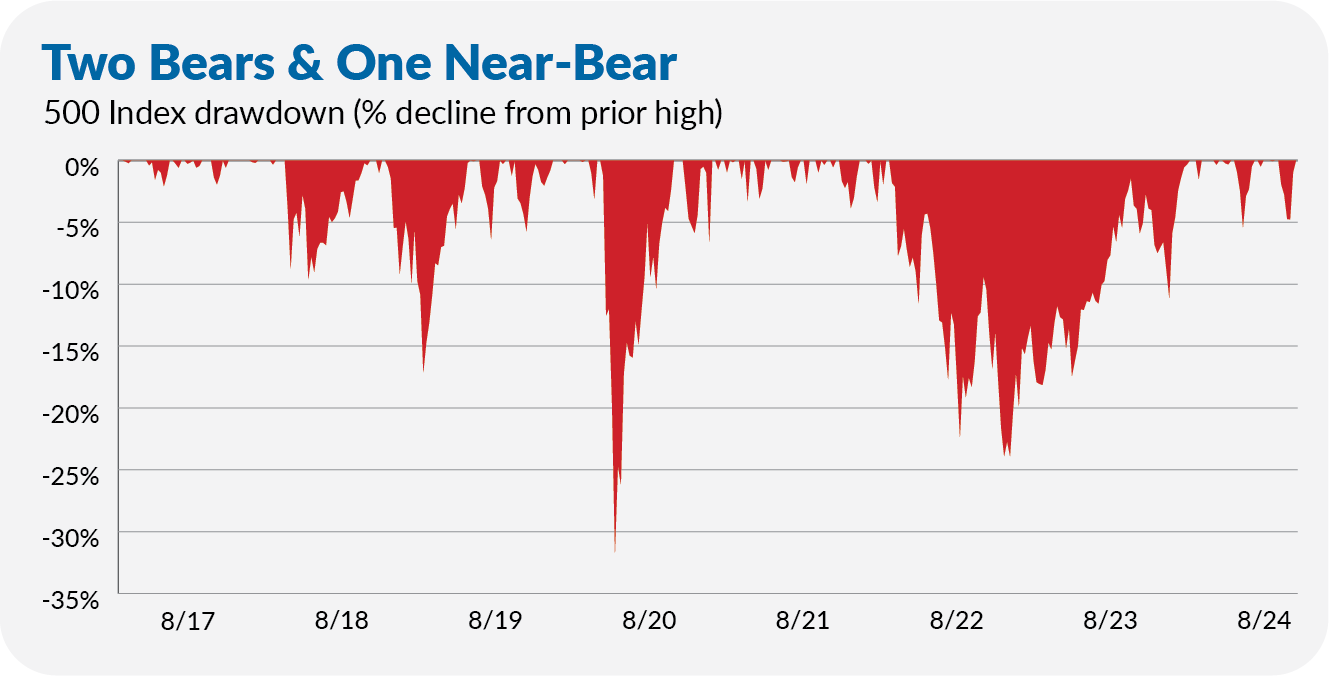
The commonly accepted definition of a bear market is when stocks have fallen 20% below their prior high. In December 2018, 500 Index’s decline approached but didn’t quite cross that 20% mark—a near-bear market.
The flagship index fell by a third in March 2020 in response to COVID-19’s emergence. Shareholders weathered another bear market in 2022 as inflation ran hotter than it had in decades and stocks fell by nearly 25%.
Earning 15% per year sounds darn good to me. At 15%, you more than double your money every five years. But it wasn’t smooth sailing—those bear markets and corrections were bigger tests of investors' nerve than the recent summer swoon. As I often say, investing is simple, not easy.
Welcome to Fall
Do you know which month has historically been the worst for stocks?