Executive summary: Market corrections and bear markets are inevitable, but history offers perspective on their lasting pain. Most downturns recover quickly, though rare, deep bear markets can take years. While past data guides expectations, the future is uncertain—staying invested with a resilient portfolio is the best long-term strategy.
If you’re going to spend time in the market, you’ll inevitably experience a stock market correction. That was the core message of a recent Quick Take. Several IVA readers asked for more detail—specifically, how long it takes to recover from corrections and bear markets. Here’s a typical response I received:
I found the stats on market corrections interesting. However, it would be a nice follow-up to have some research on the average time it historically has taken for market corrections to get back to even … We do not have 10 years for a crash or large correction to get back to even.
Ask, and you shall receive!
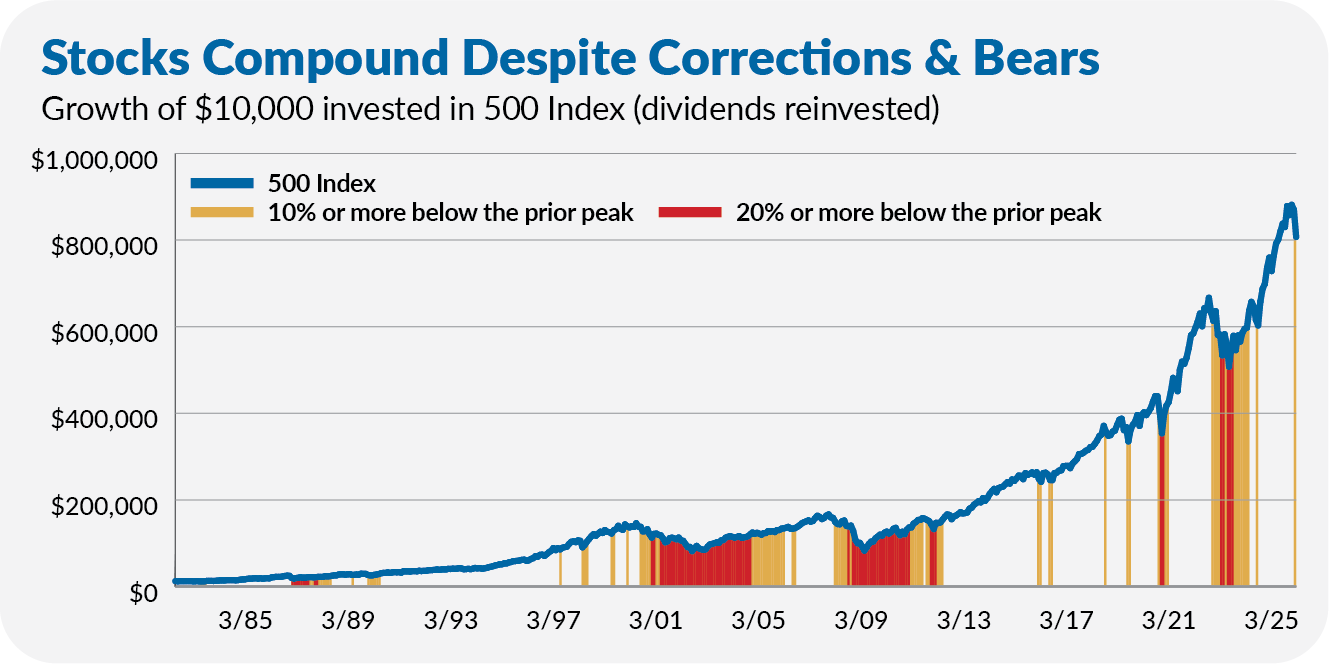
As a reminder, below is a chart I shared last week showing the trajectory of an investment in 500 Index (VFINX) over the past 40 years (when my daily total returns data series begins). The yellow-gold bars mark when the flagship fund was down at least 10% from a prior high, while the red bars show when it was in a bear market (20% or more below the preceding peak).
The table below provides the details of each market downturn. It includes the date the index fund hit bottom, its maximum decline, how long it took to reach that bottom (peak to trough), how long it took to recover from the bottom (trough to recovery) and the length of the entire episode (peak to recovery).
What stands out immediately is that two of these 16 declines were unlike the rest. Not only did 500 Index fall further during the bursting of the tech bubble (2000–2002) and the global financial crisis (2007–2009)—around 50%—but these bear markets were drawn-out affairs lasting five to six years.
To make matters worse, those two major bear markets—or “secular bear markets” in industry jargon—occurred back-to-back, resulting in a lost decade in U.S. stocks. During the 2000s, 500 Index declined 9.8% overall (including dividends), averaging a 1.0% annual loss.
So, at the bottom of the table, I’ve included summary stats that include and exclude those two events.