Executive Summary: The classic “miss the 10 best days” chart oversimplifies market timing. So does “dodging the worst days.” I combine them. The results may surprise you.
It’s become something of a habit, when the stock market takes a big tumble, for investment “gurus” (and I use the term with my tongue stuck firmly in my cheek) to trot out the old “if you missed the 10 best days in the market” stats.
While I commend the attempts to prove that “time in the market, not market timing” is the key to long-term investment success, the flip side of this argument is the boost to your portfolio if you miss the 10 worst days in the market.
I’ll get to the numbers in a moment, but suffice to say that missing the 10 best days really hurts overall total returns, and missing the 10 worst days makes your returns sing! It’s the randomness of these days, however, that makes the whole exercise pretty futile.
Plus, as I told you last week, big up days and down days tend to be clustered together. So, the slightly more realistic scenario to run is how an investor would have fared if he or she missed the 10 best and 10 worst days?
Again, the market-timing precision needed to miss these 20 days is nigh on impossible to imagine, but let’s just do the math anyway.
If you bought 500 Index (VFIAX) on June 30, 1983 (when my daily total returns data starts), stayed invested through this past Friday night (April 11, 2025) and reinvested distributions along the way, your money compounded at a 11.0% annual rate—turning $10,000 into $787,401.
The chart below shows how you would’ve fared if you had (somehow) missed the 10 best days, the 10 worst days, or both the 10 best and 10 worst days over that same time period. The risk and allure of timing the market are on full display here.
Missing the 10 best days means your $10,000 would be worth only $341,701—less than half as much as if you stayed fully invested the entire time.
That’s the risk, but here’s the siren song of market timing: If you missed only the 10 worst days, your account balance would be over $2.2 million today.
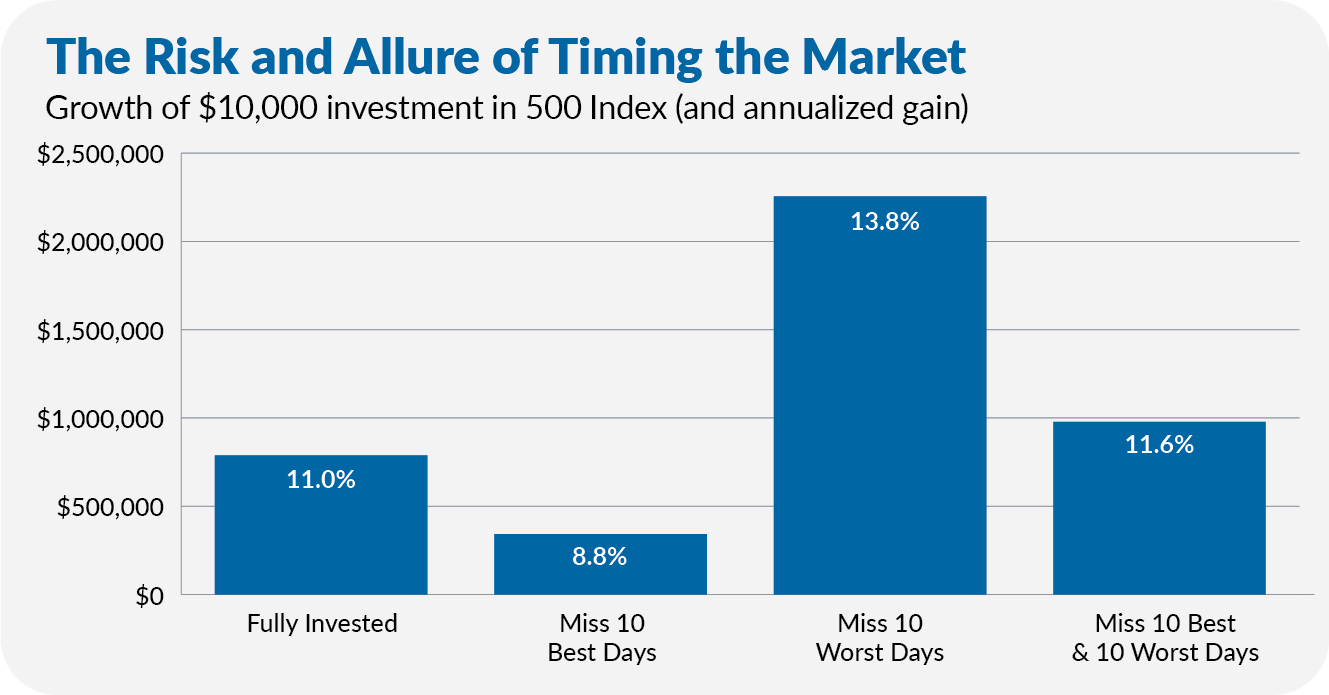
If you missed the best and worst days, you did slightly better than being fully invested—you turned $10,000 into $978,337, compounding at an 11.6% annual rate. Beating the market with less risk—or at least less volatility—is pretty darned good.
But could someone actually do this? Not a chance.
It’s preposterous to think that an investor would move entirely in and out of the market on only those specific days. Making those all-in, all-out moves would have entailed significant risk and yielded some hefty tax bills (which I haven’t factored into the numbers).
Trying to dodge the worst days might sound appealing, but catching the best ones matters just as much—and they often come hand in hand. The good news? You don’t have to try to predict the best days or the worst days. Simply staying invested keeps you in the game and gives you the best shot at long-term success.